Based on recent extreme waves in the North Sea, it is becoming increasingly clear that it is of vital importance to investigate an improved method of measuring waves. The present project utilize the LIDAR technology, through a new equipment called ‘Wave Mapper’. The technology enables the possibility of measuring a 3D-area, enabling the development of a unique database of full-scale, breaking events.
The current project is a collaboration between Aarhus University, Department of Engineering and the Danish Hydrocarbon Research and Technology Centre (Centre for Oil and Gas - DTU). The goal is that the centre by 2020 can prove that the recovery from the North Sea can be increased by an additional 100 million barrels of oil in 2020 based on knowledge and innovative solutions from the DHRTC partnership.

The technology of LIDAR has been used for several years for different purposes such as forest, urban and geoscience applications [1]. Lately, it has also been used by planes, to map coastal zones [2]. The current project will extend the usage of LIDAR, by utilizing it on a static platform. The LIDAR system is capable of recording surface elevation data up to 200 meters from the platform, with the width of the measuring surface extending up to 100 meters. The project is made in close collaboration with the company TOTAL, due to the LIDAR equipment currently being deployed on a platform owned and operated by them.

Reference:
[1] Dong and Chen: “LiDAR Remote Sensing and Applications”, CRC Press, 2018, Florida, USA.
[2] Irish et al.: “An Introduction to Coastal Zone Mapping” U.S. Army, 2001
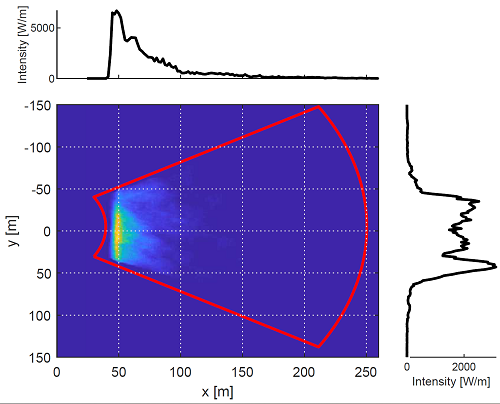
One of the preliminary challenges of the LIDAR equipment, is the signal processing of the data. The data is collected as frames of up to 570.000 points per frame, and variable x,y-data points also between frames. An advantage of the LIDAR technology is the possibility of utilizing light intensity. The intensity is defined as the ratio of strength of reflected light to that of emitted light [3]. By choosing points, where light intensity is high and plenty x,y-data points, a comparison with RADAR (here 1hour) values can be done
Reference:
[3] Song et al. : “Assessing the possibility of Land-Cover Classification using LIDAR Intensity Data”, ISPRS XXXIV 2005, 4 pages.
LIDAR + Camera(s)
Currently setting up model to verify the breaking waves


