To ensure that the wave loading is not exceeding the design basis, load monitoring must be carried out during the lifetime of the structure. Sadly, direct measurements are rarely feasible, and operators hence need to rely on indirect methods. This study focuses on indirect load measurements by analyzing structural vibrations. System identification, such as operational modal analysis is used to obtain the dynamic properties of the structure. These are consequently used in deciphering the vibrations in order to quantify the loads. Experimental campaigns are conducted on a miniature scale in a wave flume, where different loading scenarios are evaluated.

Michael Vigsø
Former Member
This study aims to quantify the accuracy of the methods for load identification. Assuming that modal parameters obtained from Operational Modal Analysis (OMA) are subjected to some uncertainty we quantify how these affect the load identification.
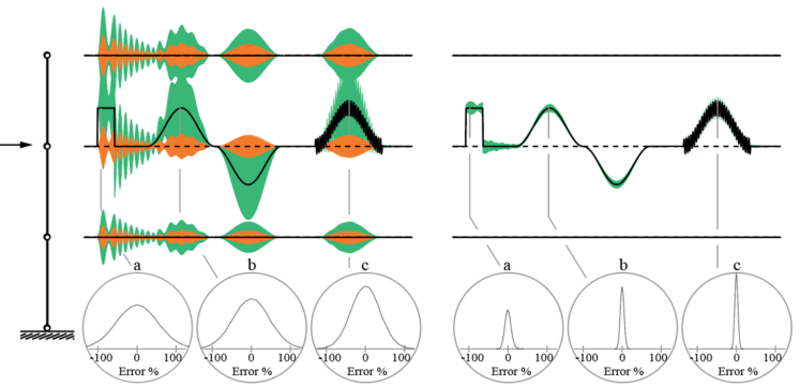
We introduce minor errors ( < 1%) in the model and the figure consequently shows the time history of the identified load . Each time series shown has a 10 sec. duration. The black lines are the true input. The hatched green area indicates uncertainty on the force while the hatched orange area is the uncertainty of the moment. Both are shown using the upper and lower 98% quantiles. Three selected points in time show the error probability density.
The findings have been accepted for publication in Shock and Vibration 2019 and presented at the iomac conference 2019.
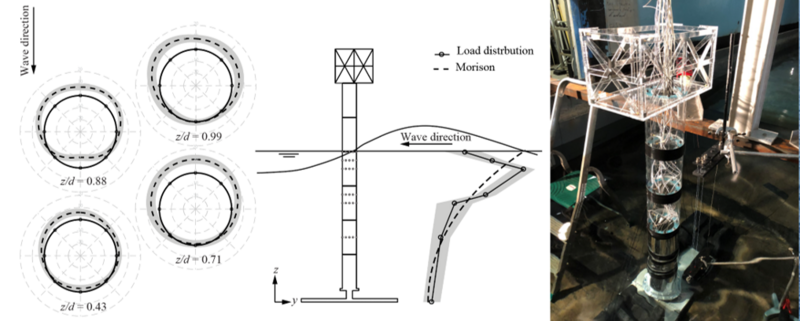
In this study, we wanted to examine the load spatial distribution in greater detail. Especially the interaction effect when a flexible structure is exposed to wave loading. From wave lab experiments conducted in Marseille, France, we used pressure sensors to map the pressure distribution. We are now working on indirect prediction of the load distribution using the structural vibrations.
Note that in the figure d is the mean water level. (90 cm).
The findings are submitted to the Journal of Ocean Engineering
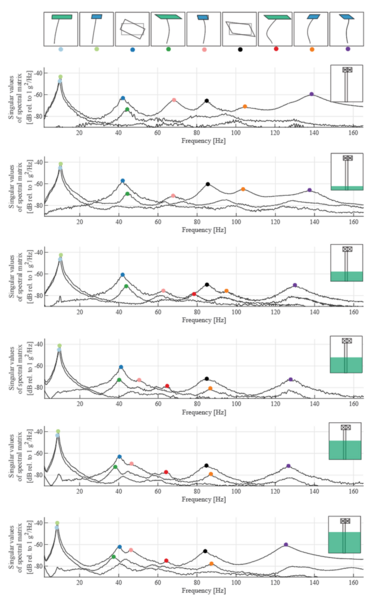
In this study we wish to study how water affects the dynamic parameters of a structure. On the figure we see how the natural frequency shifts during the water filling. We see how the presence of water does not affect all modes!
The graphs show the singular values of the spectral density. The three first singular values are shown for different water levels.
The water levels shown are 0, 150, 400, 670, 800 and 900 mm respectively. The different mode shapes identified are sketched in the top of the figure in ascending order and indicated by a coloured dot.
The findings were published in the proceedings of ISMA 2018. Vigsø et. al., Operational Modal Analysis and Fluid-Structure Interaction, ISMA 2018